LinkedIn is definitely not your everyday “This is how my life is going” place to post. Nope. Rather, it’s a space for professionals to connect with each other and with companies and where you can put your best professional foot—profile—forward for top-ranking companies and recruiters. It’s the most widely-used professional platform for showcasing whatever you and your company have to offer. In fact, LinkedIn is the “largest professional network with more than 546 million users in more than two hundred countries and territories worldwide.” Since we’ve already walked you through how to set up a personal profile and given you the best practices for creating a company page, let’s take a look at determining how well your LinkedIn social posts and campaign efforts are doing.
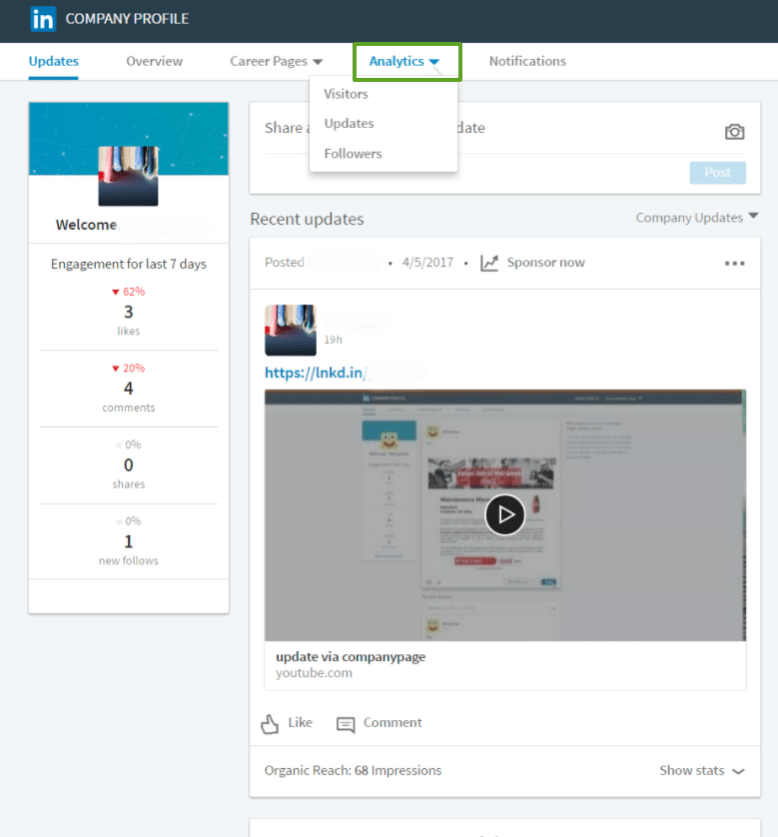
As we stated with Facebook Insights, sometimes the best way to evaluate your analytics is to go straight to the source and review your data within the social media platform itself; hence, LinkedIn Analytics is where it’s at if you want to know how your company page is performing. To view your analytics, simply go to your company page from your personal profile. Once you’re on that page, select “Analytics” at the top of the page. LinkedIn offers three categories of analytics for review: Visitors, Updates, and Followers.
Visitors
This analytic focuses on the people coming to your page to take a look. Traffic metrics measures how many unique visitors (meaning it excludes multiple visits from the same visitor) and page views your company page has over a certain period of time. The default range is for the past fifteen days, but you can change it to review longer periods of time. If you have a career page as well as a company page, you can select which page to review. A career page is a recruitment tool where you can put your company in the spotlight, so to speak, and attract candidates. The helpful graph included in this analytic shows who has come to your page and from which device. The blue line indicates mobile visitors, the red line desktop traffic.
The visitor demographics chart shows all kinds of helpful information about the traffic visiting your page. Its dropdown menu gives you several options for how to view the data:
- Job function shows you what type of work your visitors are involved in, such as media, communications, education, or administrative.
- Country shows where in the world your visitor traffic is coming from.
- Region hones in a bit more on what area of the world that traffic is coming from.
- Seniority refers to the type of visitor and what their employee level is on their LinkedIn personal profile, such as a senior employee, entry-level, manager-level, or CEO.
- Industry lets you see what field your visitors work in, i.e., publishing, internet, and higher education.
- Company size shows you the type of company your visitors work for, such as a large corporation or small mom-and-pop.
Updates
This is where you see how your content is performing. Across the top of the page, there’s a section of engagement highlights, which shows you how your overall content has performed over the last thirty days. You’ll see how many likes and comments your content received, how many shares it had, and how many followers you gained.
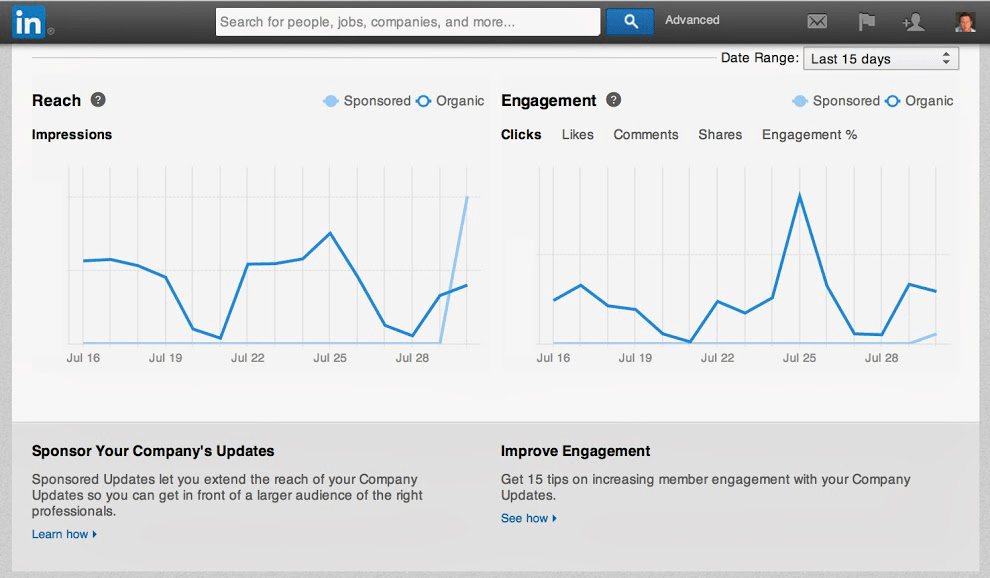
The engagement metrics chart lets you know the extent of interaction with your content over a certain time period. The blue line on this chart indicates organic reach, whereas the green line shows sponsored content, which, of course, is only available if you’ve paid to promote any of your posts.
Using the dropdown menu with this chart, you can review your overall content metrics in the following ways:
- Impressions is how often your content has been seen by LinkedIn members (includes the number of times a LinkedIn member may have seen it more than once).
- Unique impressions refers to the unduplicated number of times a LinkedIn member has seen the content.
- Clicks tells you the number of times a member has clicked on your content, company name, or logo (does not include likes, shares, or comments).
- Likes indicates the overall number of likes your content has received.
- Comments tells you how many comments your content has received.
- Shares shows the number of shares for all of your content.
- Followers acquired displays the number of followers gained by sponsored content.
- Social engagement % is a look at the overall percentage of social media engagement with your content. It’s the number of interactions plus the number of clicks and followers acquired, divided by the number of impressions.
Below the engagement metrics, you’ll find a list of the individual posts you have made and the metrics for how each post performed.
- Date refers to the date you published the content.
- Followers acquired indicates the number of followers acquired—this will be blank if you did not pay to sponsor this piece of content.
- Impressions tells you the number of times someone has liked, commented, or shared your post.
- Clicks refers to the number of clicks on the content, company name, or company logo.
- CTR (click-through-rate) is the total number of members who click on a specific link.
- Social actions gives you the number of times people have liked, commented on, or shared the post.
- Engagement is the number of interactions plus the number of clicks and followers acquired, divided by the number of impressions.
Followers
Follower highlights shows you the total number of followers as well as the change in organic and acquired (sponsored) followers in the last thirty days. Below the highlights is a graph for follower gains that shows you how many people have followed your page during a certain period of time. You can change the time period for which you want to review the data with the dropdown menu on the right.
Below that is a helpful chart detailing follower demographics:
- Geography shows you in which countries your followers are located and also gives you the top five regions your traffic is coming from.
- Job function—as with visitor demographics, this shows you the type of work your followers are involved in.
- Seniority refers to the type of follower and what their employee level is on their LinkedIn personal profile, i.e., senior, entry-level employee, trainee, or owner.
- Industry focuses on what industries your followers work in, such as publishing, internet, or higher education.
- Company size allows you to see the top five company sizes your followers work for.
- Employment status lets you see how many employees at your company are following the page, as well as the number of nonemployees following it. (Tip: it’s always good to have more nonemployees following the page!)
Companies to Track
This handy little section shows you follower analytic data for companies comparable to yours. The time period is defaulted to show data for the past thirty days, but you can adjust it using the dropdown menu on the right. You can see how your number of followers stacks up to the other companies’, and you can compare their follower growth, number of updates, and social engagement to yours. This useful information helps you know how your competitors are doing and is a handy gauge for where to set your goals for attaining followers. You can also click on various companies and take a look at the content they are posting. And chances are good that you’ll glean a few ideas on your next content move based on what they are posting and how often they are sharing articles.
So there you have it—the lowdown on LinkedIn Analytics. Do you have any tips or tricks up your sleeve to help our readers make the most of using LinkedIn Analytics? Please share them in the comments!









Hi Lindsay,
Quick question, we’ve just started to work with our LinkedIn channel and I saw that we have 15.000 impressions for our fist video. It seems a bit unreal, so that’s why I want to ask you, if it is correct to say that we have realised so many likes, shares or comments on our post?
Thanks for your help!
Hi, Wim!
Wow, congratulations! I have heard of people getting enormous numbers on video views on LinkedIn. You must be doing something right! You might be interested in this article: https://www.socialmediaexaminer.com/linkedin-native-video-what-marketers-need-to-know-viveka-von-rosen/, as it shares a LinkedIn story similar to yours.
Keep up the good work!