We’re continuing our three-part series on how to use platform-based analytics, and today’s topic is Instagram Insights. If you didn’t get a chance to read our previous two posts about Facebook and LinkedIn analytics, no problem. You can go back and read them once you’re done here.
So, why, for the final post in this series, are we looking at Instagram rather than Twitter? Well, for one, we’re not looking at Twitter in this series because, as stated in our 2018 social media predictions post, Twitter is likely heading in a new direction, and with that, the platform and its tools will likely see change. And, two, Instagram has 500 million daily users and 80 million photos shared per day. And it’s growing!
And what’s more, the statistics for users interacting with brands on Instagram is ten times higher than for Facebook, and 90 percent of the top one-hundred brands have an Instagram account. If these stats aren’t enough to convince you that Instagram is a veritable goldmine for business, maybe this last one will: Instagram users are 70 percent more likely to purchase products using their mobile phones, and Instagram has been, from its inception, a mobile app (although you can use it on the desktop as well).
So now that you know about Instagram’s statistics, let’s switch gears to the statistics that matter most: the ones you determine using Instagram’s analytics. At first glance, these analytics can be overwhelming, but don’t lose yourself in a sea of metrics and numbers—keep in mind that you only need to track what’s most valuable to your business and your social media marketing goals for Instagram. And remember that “being mobile-friendly” fact? Instagram Insights is accessible right on the app from your phone or device. Just tap on the little graph icon in the upper right-hand corner and you’re there.
Start with Your Audience
Understanding the demographics of your audience is key to marketing success on any platform, and Instagram Insights offers, well, valuable insights about who’s looking at your content. You can find these metrics in the “Followers” section:
Are you reaching the correct audience?
Take a look at the Gender and Age metrics. This information can help you determine whether you’re reaching the right audience and help you adjust what type of content you post and when. For example, if you have a younger audience, you may want to post memes and other types of content that generally attract engagement from younger users.
Where in the world is your audience?
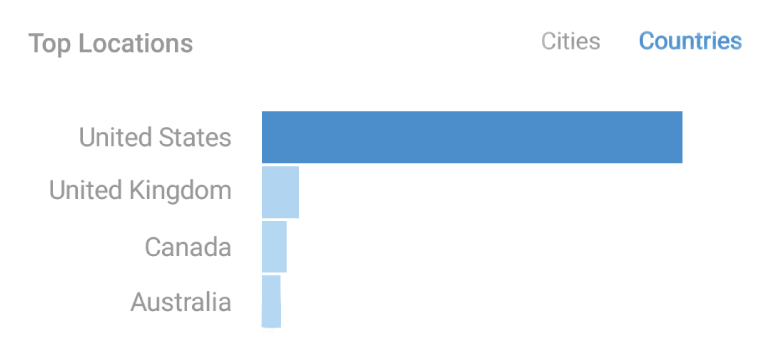
It’s always helpful to know the Top Locations your audience physically resides. Instagram not only lets you determine the time zones they are in—so you can post at the best times—but you can use this information to reach out to local audiences should you want to advertise a local event, such as a brick-and-mortar store opening or seminar.
When is your audience active?
This metric helps you determine when to post based on which Days and Hours your audience is most active on the platform and checking out your profile. Armed with this information, you can schedule posts during those hours and days, thus increasing your chances for higher engagement.
Picture-Perfect Profile
A picture is worth a thousand words, right? Since Instagram is a visual platform, all of your content is going to be limited to what you can say with a photo (granted, you can use memes and graphics). But the only place you can share clickable content is on your profile, so any link you place there is incredibly important.
The Website Clicks metric tracks how many people have clicked on the link in your profile. You can change this link at any time, so if you have a special event coming up or a new product being released, you can add the direct link to that page to your profile and direct traffic there. If your post generates a website click, you’ll see that data here. Click on “View Insights” for each individual post, and in the Actions section, you’ll see how many website clicks your post has generated.
You can also see Follows and Profile Visits here.
- Follows is similar to the other platforms’ analytics for tracking followers. This metric lets you see how your follower count has grown in the past seven days. And just a reminder—as with all platforms, this metric is more about capturing the right kind of follower, not having thousands of the wrong kind. You’ll also see this information at the top of the page after you click into Insights.
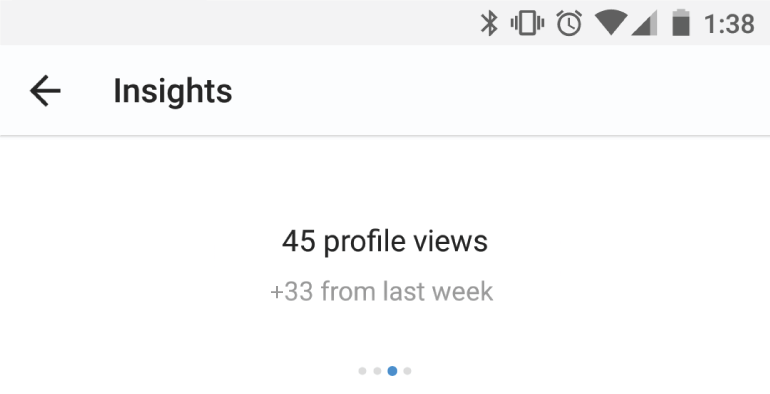
- Profile Visits tracks how many people have looked at your profile. Even though they may not follow you, they’ve taken a look, and that gives you an idea of how many people are interested in your content. You can also find this information in the second metric listed, third swipe in, after you click into Insights.
Cap It Off with Content Metrics
As always, what keeps audiences coming back is content. That’s why taking a look at your content metrics is going to be the most valuable analytic you review (in any platform!).
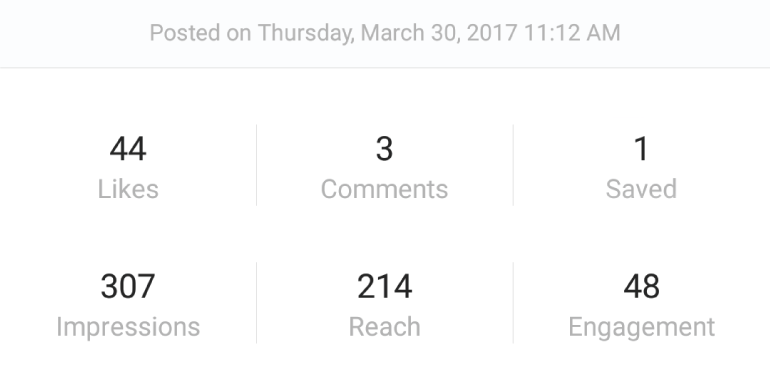
- Likes indicates how many people liked your post. It doesn’t take much effort on the user’s behalf to like your post—all they have to do is tap the heart icon as they scroll through their feed.
- Comments are a step further in the effort area because they come from users who pause in their scrolling to voice their opinion about your content. While you’re never guaranteed positive feedback, with the fact that you could potentially continue to see comments eighteen to twenty-four hours after you post the content and even all the way up to nineteen days, there’s ample opportunity to receive both constructive criticism and positive feedback!
- Saves is a fairly new feature Instagram released in 2016. It allows users to save favorite posts. You can see how many of your posts have been saved as favorites, which is always useful to know—and it’s a good feeling to know you’re someone’s favorite.
- Impressions is, similar to other platforms, the number of times your post has been seen by users. This gives you a good idea of how many people have at least seen your post, either through newsfeed or searching, but the more useful metrics come from Reach and Engagement.
- Reach is also similar to other platforms and to Impressions. The difference between these two is that Impressions tells you how many times your post was seen, but Reach tells you how many people or accounts viewed it. For example, a single person could have seen your post multiple times (by scrolling by it more than once or even through a search), but the post only reached that person's account once.
- Engagement is the aggregated data of likes, comments, and saves from individual and unique accounts. This metric helps you to see how well your content is performing overall.
Now that you know how to decipher the awesome analytics Instagram has to offer, which ones are you going to use to measure your success and set your goals? Or which are you already using? Comments welcome below!











Add a Comment