As part of the application process, you’ve been requested to complete the following challenge. If you have any questions please respond to the last email you received from our team.
The intent of this challenge is NOT for you to spend all of your time working on this — we're looking for you to spend a max of 2-4 hours on this challenge.
Brief
The main page in the WordPress admin interface is called the Dashboard. The Dashboard contains a set of configurable “Dashboard Widgets” that are basically a “Card” or “Tile” user interface element.
This is what they look like:
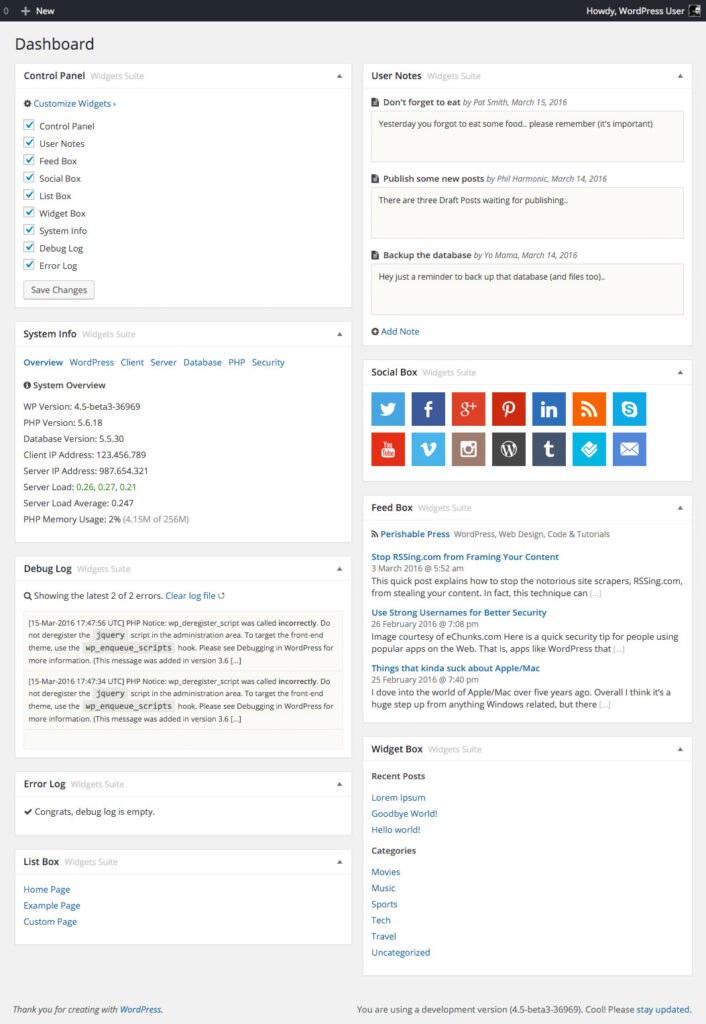
WordPress plugins (such as MemberPress) have the ability to add custom widgets to the Dashboard. These widgets can be dragged, dropped, collapsed and don't have any limitations in functionality other than the amount of size they take up.
We want to create a Dashboard Widget for MemberPress to show the user a quick health check by displaying vital data at a glance about how their membership site is performing.
We want you to take the provided data that MemberPress can possibly show the user, pick what you think will be the most vital info to show to help them understand how their membership site business is performing. Remember, this is a very small space to work with and so you should simplify to the point where you're showing only the most important data to the user.
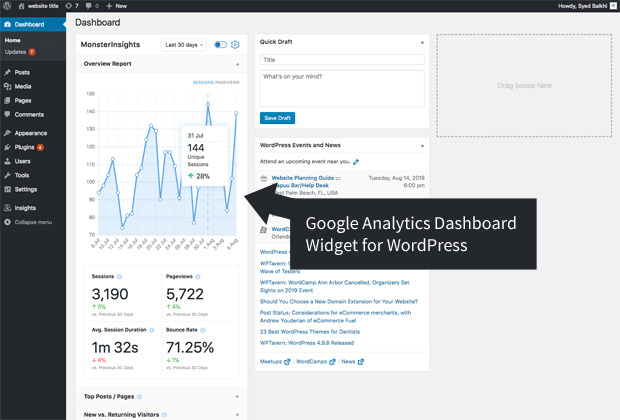
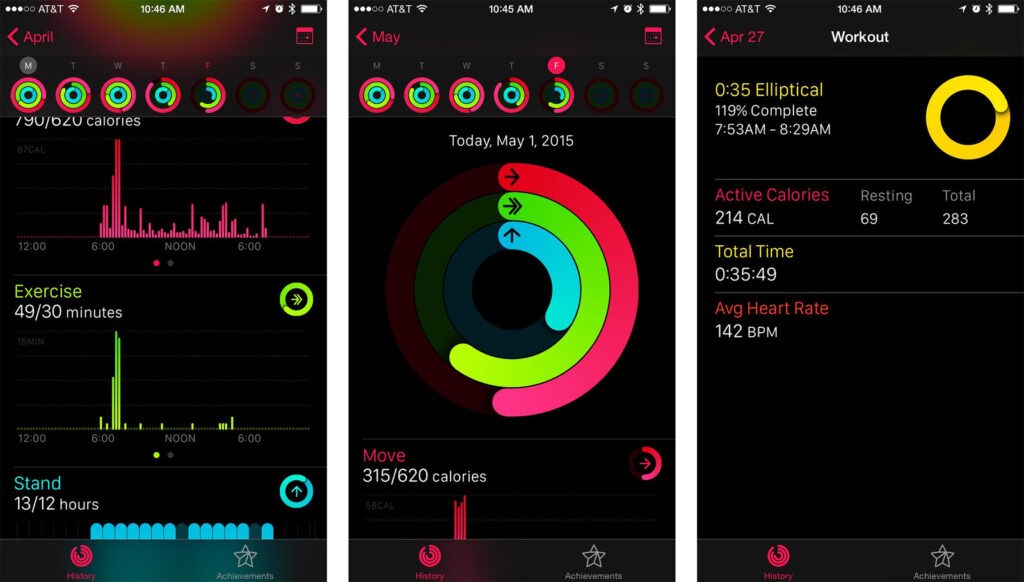
You can take hints from other applications that visualize data in a simplified card-like way such as the Dashboard Widget from MonsterInsights, health data visualization from Apple's HealthKit/Activity or other apps. This is not a requirement and is not a direction on how we want it to look and behave — just something that may help you get started.
Data
Click here to get the data that can possibly be displayed
Requirements
- Design a “Membership Site Health Check” Dashboard Widget that can be rolled out as part of MemberPress
- The Dashboard Widget must include MemberPress branding: no need to reinvent the wheel as far as the logo goes, just utilize the assets found here.
- Determine the best possible data to show the User so that they can know how their membership site is doing at a glance. Remember that some Users will login every day, some every quarter so make sure the Dashboard Widget works for all of them.
- Determine the best possible design to present the health check data
- The deliverables will include:
- An image or interactive document of what this Dashboard Widget could possibly look like.
- All wireframes and intermediate images that lead you to the ultimate design
- A small write-up that includes information about the research you did, why you made the decisions you did and why you think this is the best solution for the users.


